Dazbo's GCP Skillsboost Challenge Lab Walkthroughs
My experience and walkthroughs with the GCP Skillsboost Challange Labs.
Monitor and Log with Google Cloud Operations Suite
See Challenge Lab
Challenge
We’re told that we have a Cloud Function that is responsible for subscriber video file upload and subsequent transcoding. We need to make use of Google Cloud Operations to provide insight around use of this Function.
In this lab, we’re going to:
- Initialize Cloud Monitoring.
- Configure a Compute Engine application for Cloud Operations Monitoring custom metrics.
- Create a custom metric using Cloud Operations logging events.
- Add custom metrics to a Cloud Monitoring Dashboard.
- Create a Cloud Operations alert.
General Guidance
We’re given some tips. These definitely make life easier! We’re told that:
- The startup script for the Compute Instance is in the Compute Instance metadata key called
startup_script. - The Compute Instance must have the Cloud Monitoring agent installed and the Go application requires environment variables to be configured with the Google Cloud project, the instance ID, and the compute engine zone.
- The Video Queue length monitoring Go application writes the queue length metric data to a metric called
custom.googleapis.com/opencensus/my.videoservice.org/measure/input_queue_sizeassociated with the gce_instance resource type. - To create the custom log based metric, the easiest filter to use is the advanced filter query textPayload=~”file_format: ([4,8]K).*”. That is a regular expression that matches all Cloud Operations events for the two high resolution video formats you are interested in. You can use the same regular expression and configure labels in the metric definition, which creates a separate time series for each of the two high resolution formats.
- You must use the name provided for the custom log based metric that monitors the rate at which high resolution videos are processed:
Custom Metric Name.
My Solution
This is a fairly quick lab, so I didn’t bother doing it with the Cloud CLI. All the steps described below are done using the Google Cloud Console.
Task 1 - Configure Cloud Monitoring
A basic Cloud Monitoring dashboard, called Media_Dashboard has already been made available to us, but we have to enable Cloud Monitoring in our project.
This is super-easy to do! Just navigate to Monitoring from the Console.
Task 2 - Configure a Compute Instance to generate Custom Cloud Monitoring metrics
We’re told we have a monitoring service which creates a custom metric called opencensus/my.videoservice.org/measure/input_queue_size. This service runs as a Go application on a Compute Engine instance called video-queue-monitor. The Go application uses OpenCensus to write custom metrics to GCO. The instance has already been deployed for us, and a startup-script installs and runs the monitoring application. The startup-script is incomplete.
From the console, edit the instance, and navigate to Management -> Metadata. Look at the startup-script.
You’ll see that the script requires you to supply the project ID, instance ID, and zone. We’re given the project ID and zone already. We can get the instance Id from the Basic information view of the VM.
Add these values, save your changes, and now reset the instance.
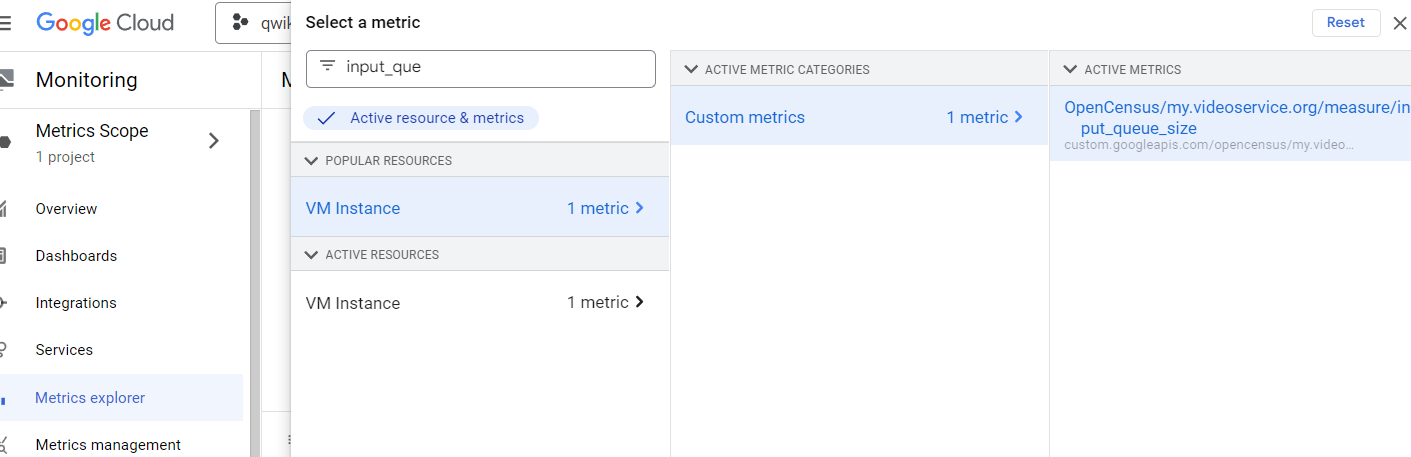
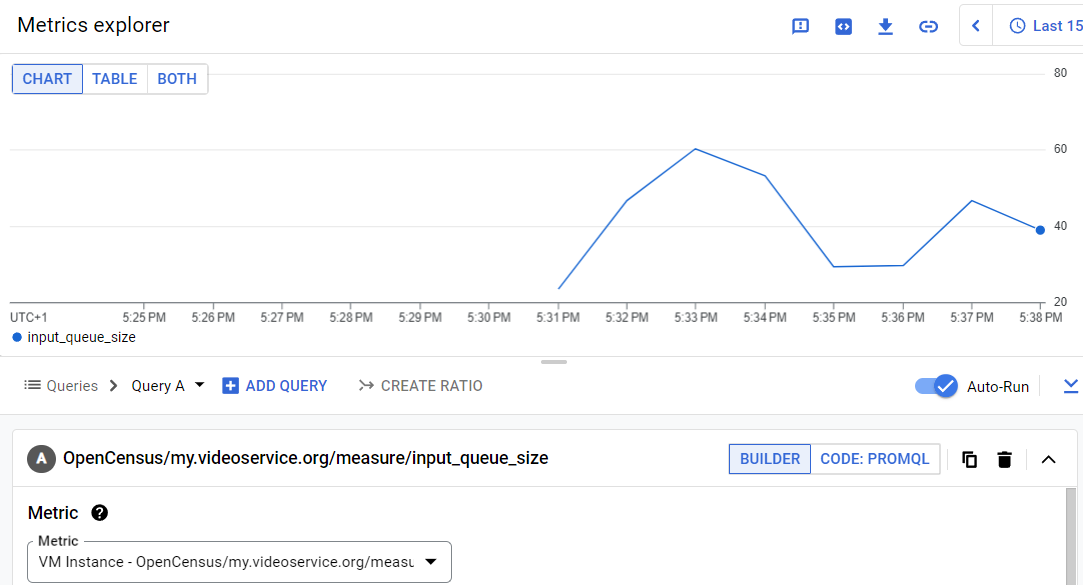
Then check tha metric input_queue_size is being written, in the Metrics Explorer. Note that it might take a few minutes before the metric is visible. So refresh the Metrics Explorer, then from the Metrics dropdown, you can search for input_queue.
Task 3 - Create a custom metric using Cloud Operations logging events
Here we’re going to create a custom metric from logs. We’re told that a Cloud Function creates a log entry that includes metadata. We need to create a custom metric by reading the log entries, and using these to determine the rate at which high resolution video files are uploaded.
Navigate to Logging -> Logs Explorer.
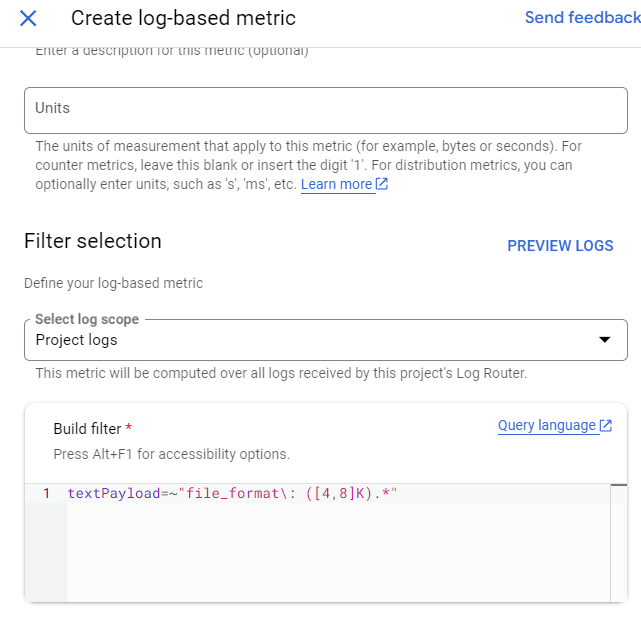
Click on Create metric. Use the following values:
Type = Counter (the default)Name = large_video_upload_rate(your metric name might be different)textPayload=~"file_format\: ([4,8]K).*"
(Note that we’ve already been given the advanced filter query.)
Task 4 - Add custom metrics to the Media Dashboard in Cloud Operations Monitoring
Select Monitoring -> Metrics Scope -> Dashboard. Then select Media_Dashboard from the list of dashboards. (This dashboard has been created for us already.)
First Chart
- Add widget -> Visualisation -> Line
- Select a metric -> Metric dropdown -> Search for “queue” to find your custom metric. Apply.
- Apply again.
Second Chart
- Add widget -> Visualisation -> Line
- Select a metric -> Metric dropdown -> Uncheck “Active resources & metrics” -> Search for
large(or whatever your logs-based metric was called), to find your metric. Apply. - Apply again.
Task 5 - Create a Cloud Operations alert based on the rate of high resolution video file uploads
Here we need to trigger an alert if our upload rate exceeds the specified value. We can create an alert using the logs-based metric we created previously
Navigate to Logging -> Logs-Based Metrics. Select the three dots next to the logs-based metric for video upload rate, and select Create alert from metric.
Select New condition, and use these parameters:
- Rolling window = 1 minute
- Rolling window function = rate
- Time series aggregation = none
Select Configure trigger, and use these parameters:
- Type = Threshold
- Alert trigger = Any time series violates
- Threshold position = Above threshold
- Threshodl value = the value you’ve been given
Select Notifications:
- You can turn off
Use notification channel. - Or, if you prefer, you could have it send notifications to an email address.
Name the alert policy. You can choose whatever you like. I called it Uploads exceeded threshold.
Finally, click on Create policy.
And that’s it!